What’s the one thing that STEM students obsess over for a whole summer, spend eons in the lab trying to figure out, and lose hours of sleep over? Data collection. And yet what’s one thing that STEM students put off doing until their poster presentations, slapping together a few graphics in Photoshop and calling it a day? Data visualization.
It seems counterintuitive that after dedicating so much of their personal and emotional capacities to their summer research projects, students tend to gloss over and even dread the idea of presenting their data in a graphical manner that makes sense to those outside of their lab. Perhaps it’s because they fear finding out their own artistic limitations. Perhaps they’re burnt out from all the hard-core science they’ve conducted over the summer and need a break. To me, it seems that STEM students spend so much time avoiding the data visualization process because it doesn’t seem to be a part of the “official” research they’re conducting. To be fair, the poster sessions are built into their SURF programs, and they’re aware that they’ll need to present their data eventually. However, are they really forced to think about how a less scientifically-inclined audience might interact visually with every aspect of their posters? Hardly. That is, until Saul Slezas came onto campus.
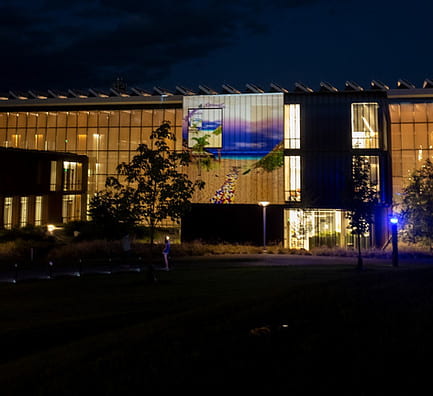
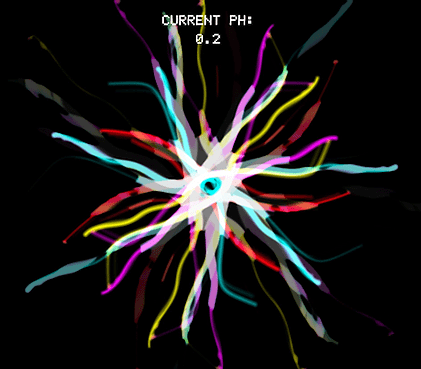
On Friday, September 4th, and Saturday, September 5th, Slezas and his team set up a projection installation that used our very own Science Center’s west wall as a backdrop to showcase the data of Amherst College students and professors. Slezas collaborated with many STEM departments and received submissions ranging from neuroscience research on developmental lead exposure (Aditi Nayak ‘23) to LiDAR elevation measurements in the vicinity of Amherst College (Professor Nick Holschuh). Other interesting projects included the O’Hara lab’s work on isoelectric points and charges at various pHs for insulin and three species of alpha-beta crystallin (Yusrah Kaudeer ‘21 and Esi Obeng ‘22); ocean temperature samples on a research cruise at the Woods Hole Oceanographic Institute (Kate Redmond ‘23); and a Prussian blue assay that determines polyphenol content in solution (Audrey Orlowski ‘23 and Nicholas Jorden ‘22). It appears that Slezas’s presence may be inspiring students to adopt a new attitude vis-a-vis data visualization.
While this was his first time projecting STEM data as a video projection, Slezas, a lighting veteran, has worked with light design for much of his life, mainly as the lighting designer for several bands on tour in the area. Even with all his experience, there were challenges to actualizing his ideas; Slezas mentioned the notorious bronze grating that covers the Science Center windows was a large hurdle, claiming the color “eats light.” Certain layering aspects of the grating also distorted several animations that Mr. Slezas had envisioned, but he stated that this layering has potential for certain optical qualities that a flat surface can’t provide.
Slezas and his colleague Jazer hope to be back at the Amherst College campus soon for a second version of the data visualization project, this time with more student facilitation. He hopes to lead a Zoom class or an independent study seminar where students could work with the both of them to create a light projection, and he encourages STEM student participation in this project! Click here to watch the promo video for the project and here to sign up for the Digital Media Project.